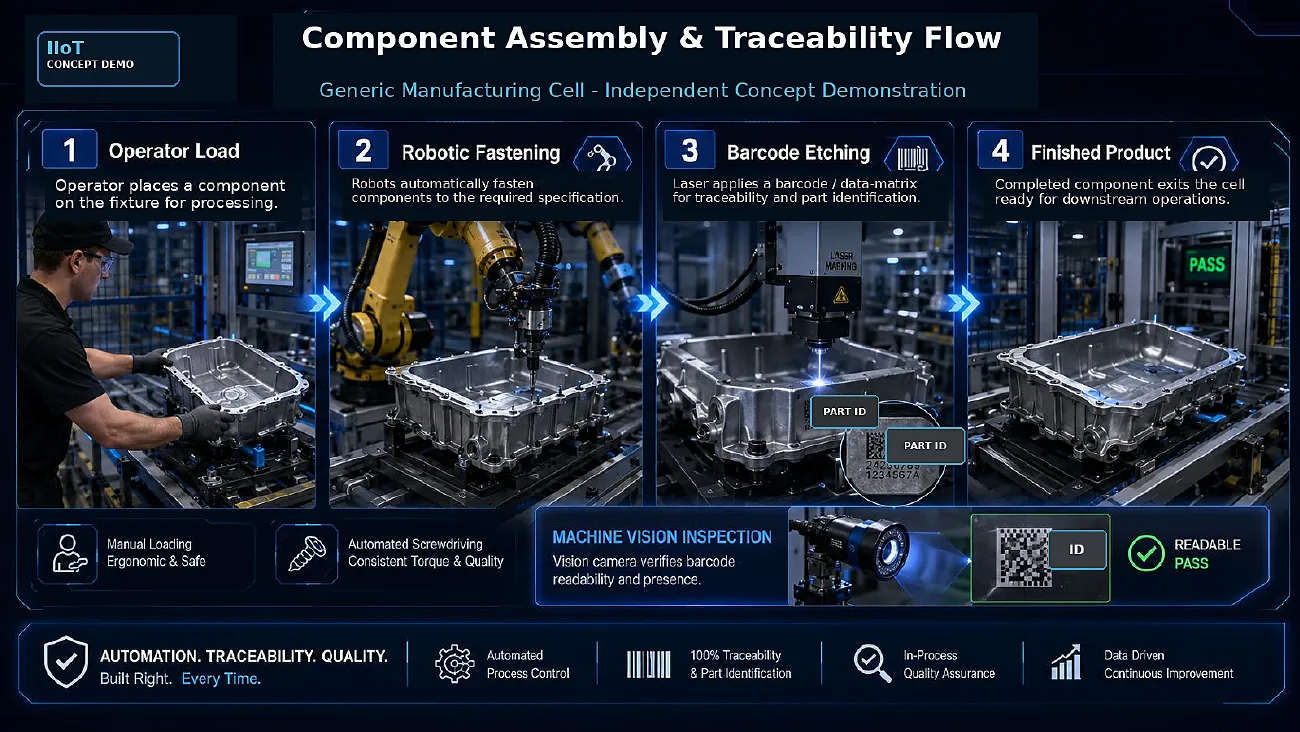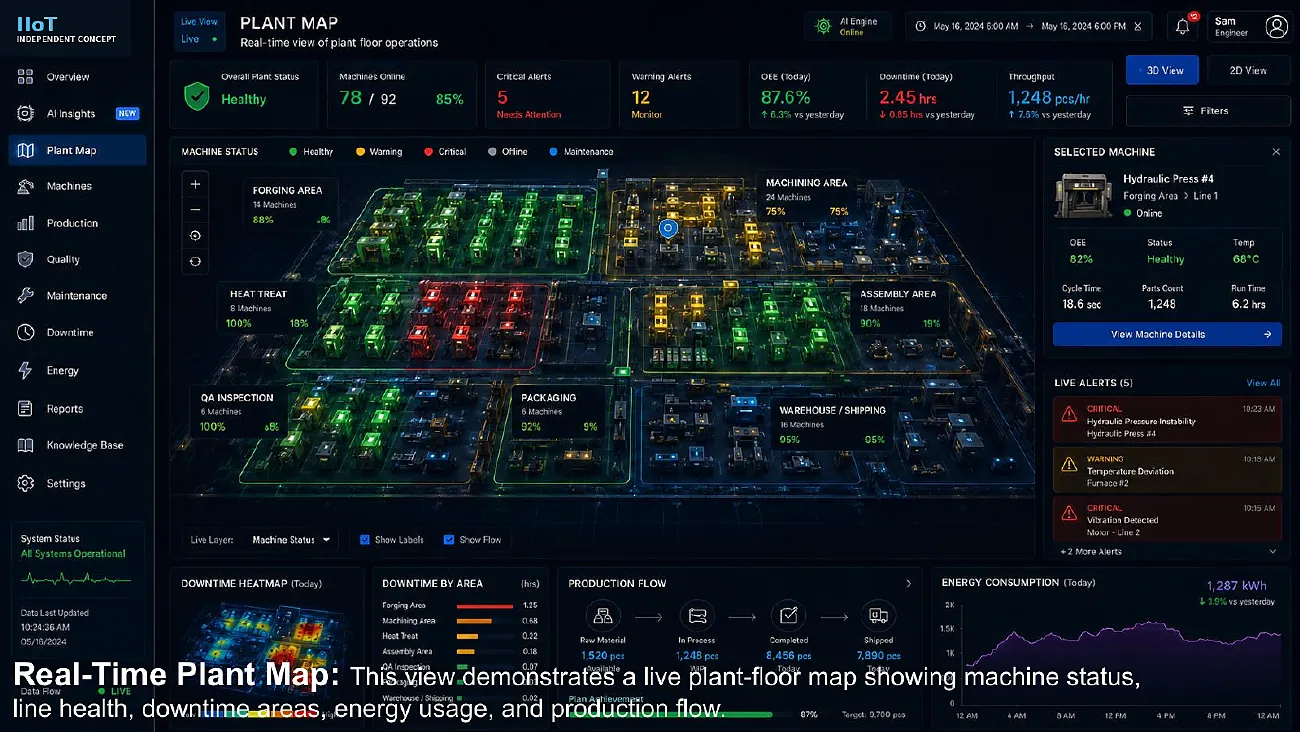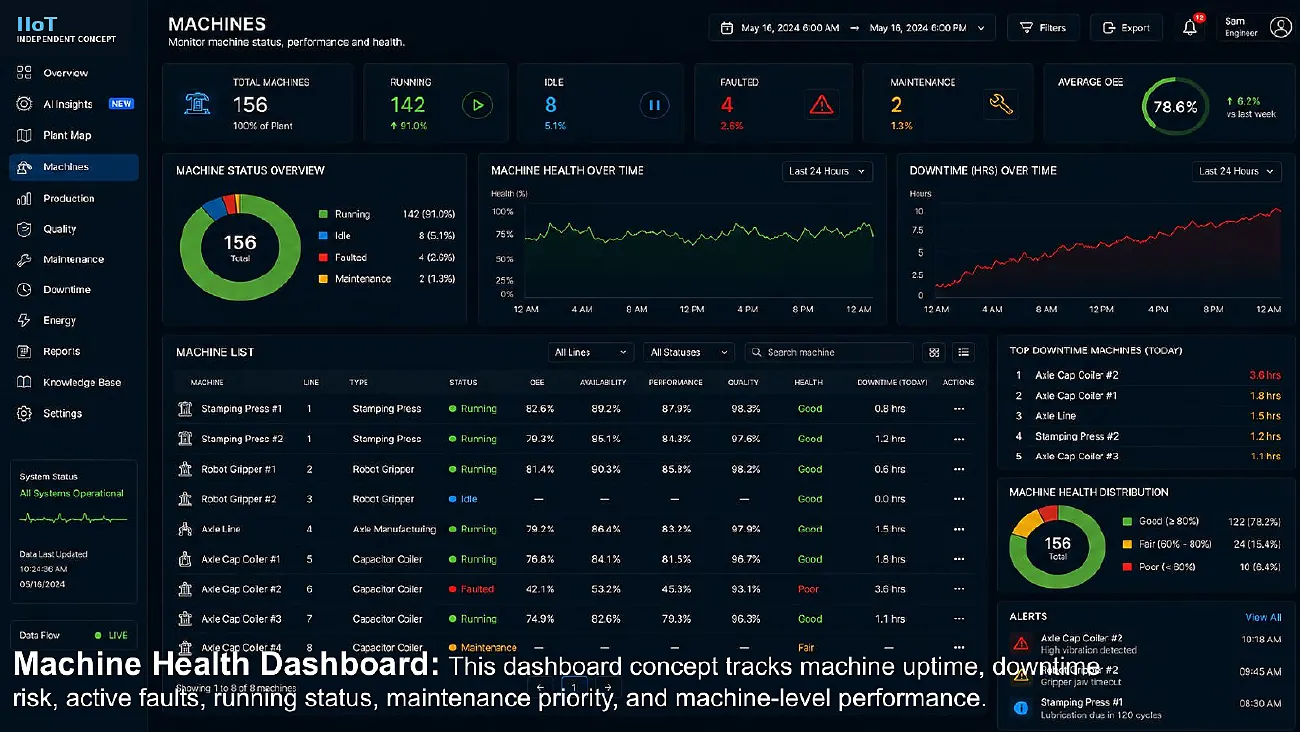












SCADA prototype in Ignition Perspective, simulated data
Ignition data center BMS/EMS demonstration
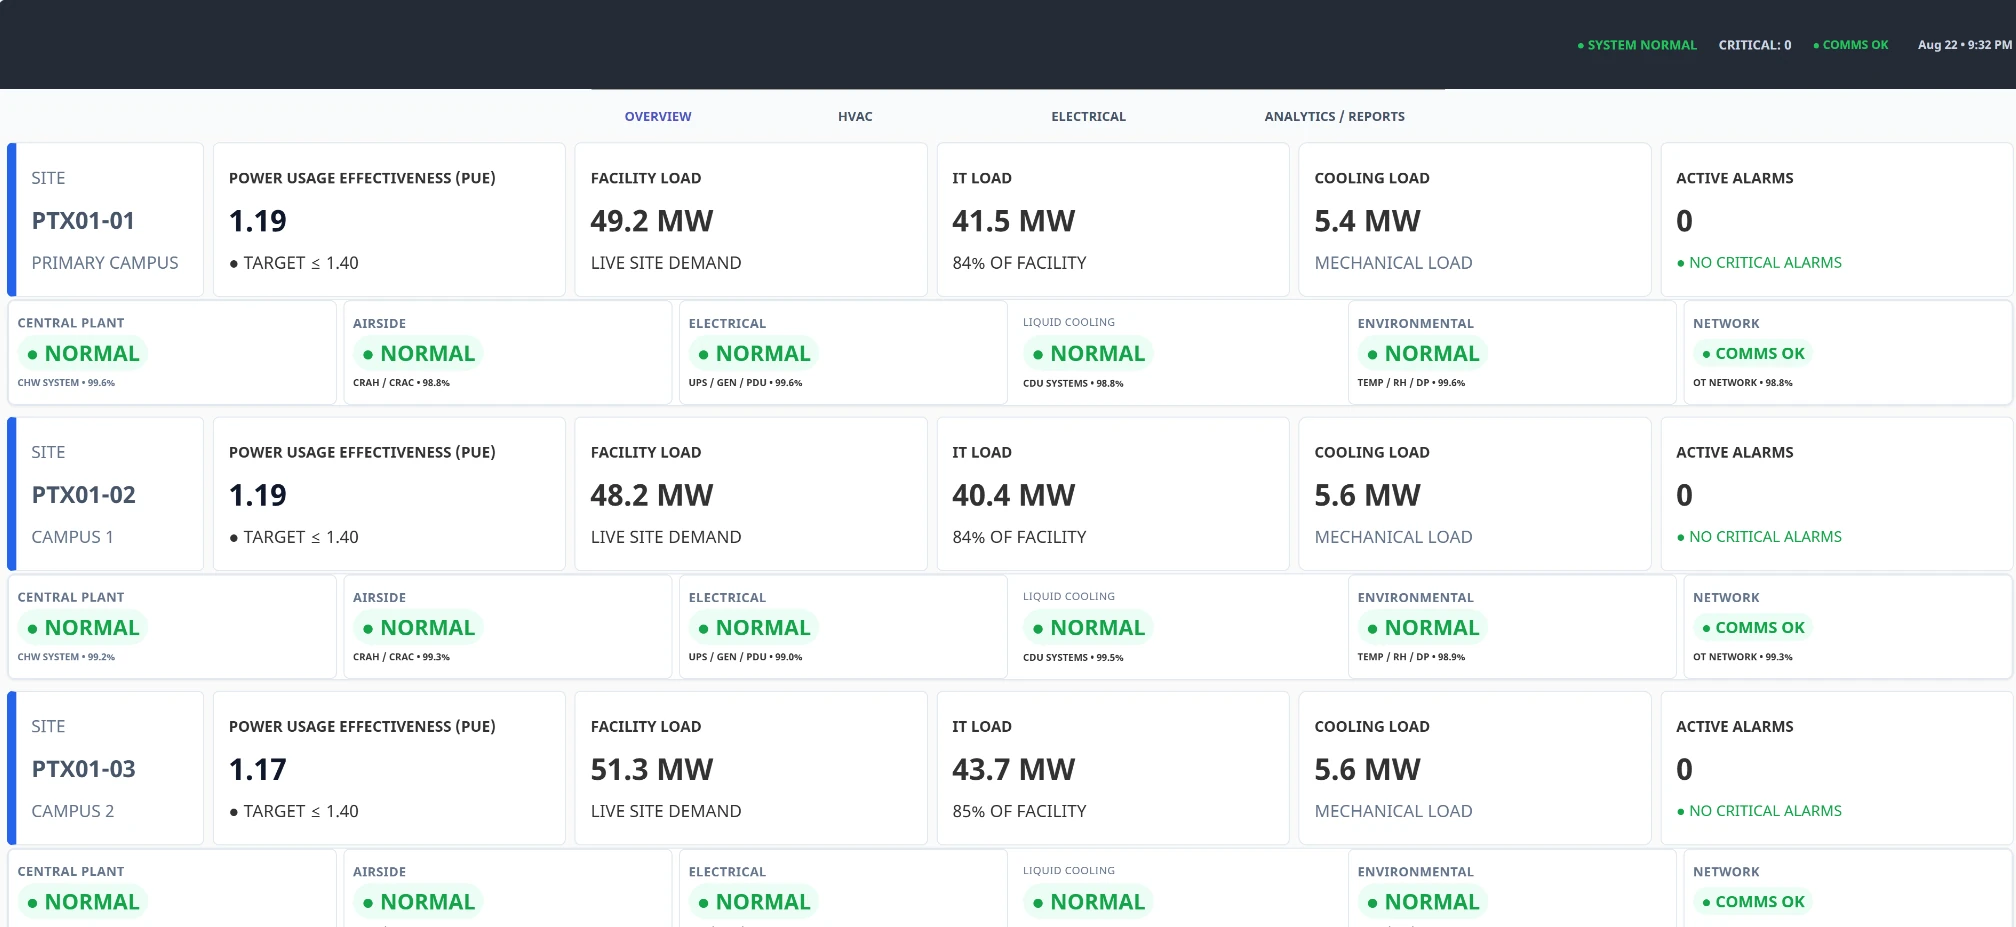
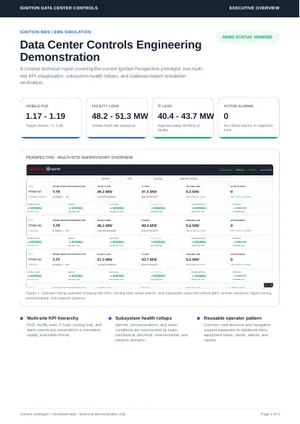
- Site KPIs: PUE against its 1.40 target, then facility, IT, and cooling load, and active alarms.
- One health status for each subsystem group.
- Navigation to the HVAC, electrical, and analytics views.
- Header: system status, critical alarm count, and communications.
- Problem
- A multi-site data center operator needs one screen that shows which site needs attention, and in which subsystem.
- What I built
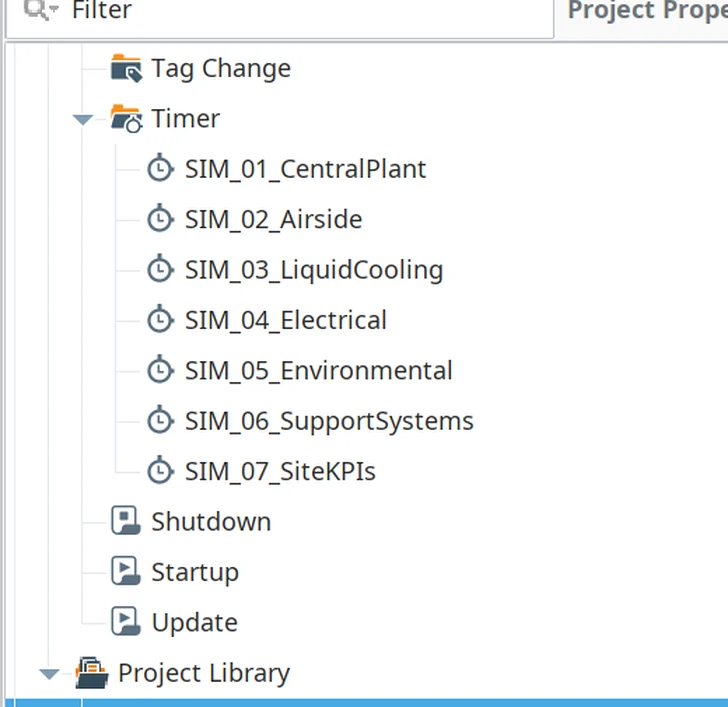
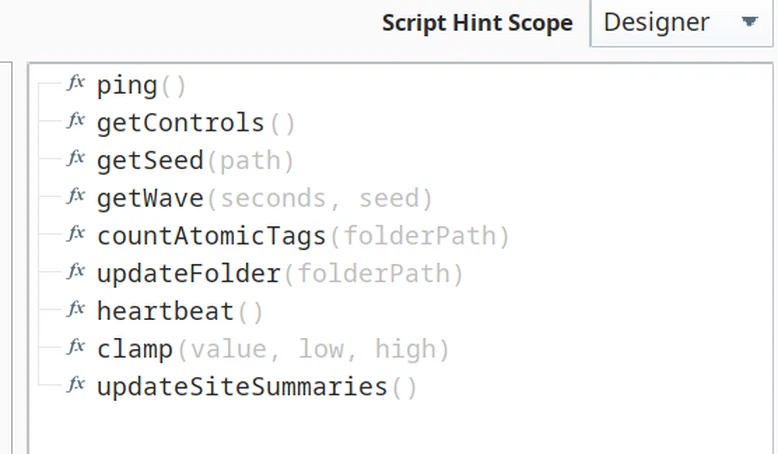
- Perspective views for a multi-site overview, a tag model organized by domain, and the Gateway simulation that feeds it: seven timer scripts sharing one script library.
- What I verified
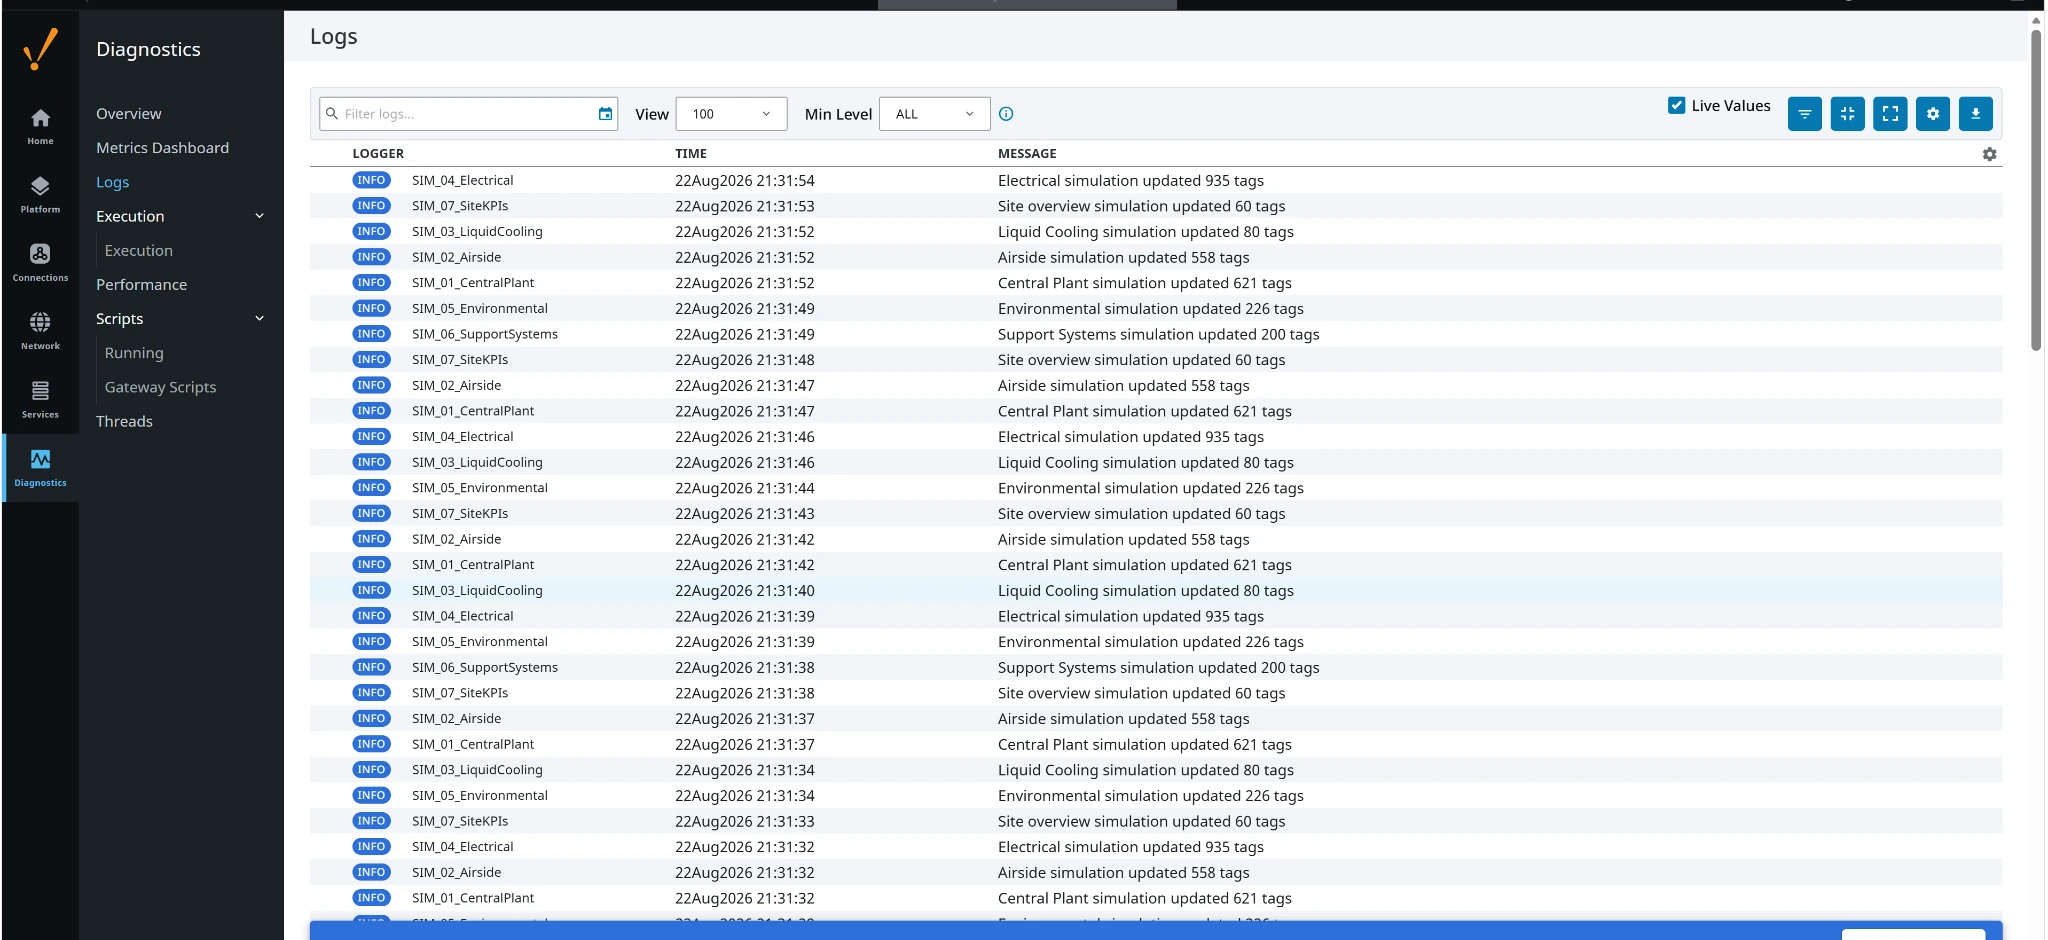
- One documented snapshot: all seven script groups executing and logging, KPIs populated on screen, status indicators visible, and no errors in the captured Gateway log.
Original documents
Verification record
| Test condition | Expected | Observed | Evidence |
|---|---|---|---|
| Gateway running the seven simulation timer scripts | Every group executes on each pass | PassAll seven groups executing | Gateway log |
| One complete refresh | Each group logs the number of tags it updated | Pass2,680 updates logged across the seven groups | Gateway log |
| Overview open in a Perspective session | KPI values populated for every site | PassPUE 1.17 to 1.19; facility load 48.2 to 51.3 MW | Overview screenshot |
| Same session | A status shown for each subsystem group | PassAll six shown as Normal on every site | Overview screenshot |
| No fault injected | No critical alarms | Pass0 active | Report, page 3 |
One captured snapshot. A fault and its recovery have not been tested on this build.
Read the case study
Design decision
One timer script per subsystem instead of a single simulation script. Each group then appears by name in the Gateway log with its own update count, so a group that stalls or fails is visible on its own. Tag writes are collected and sent as one batch per pass, not tag by tag.
Tag structure and rollups
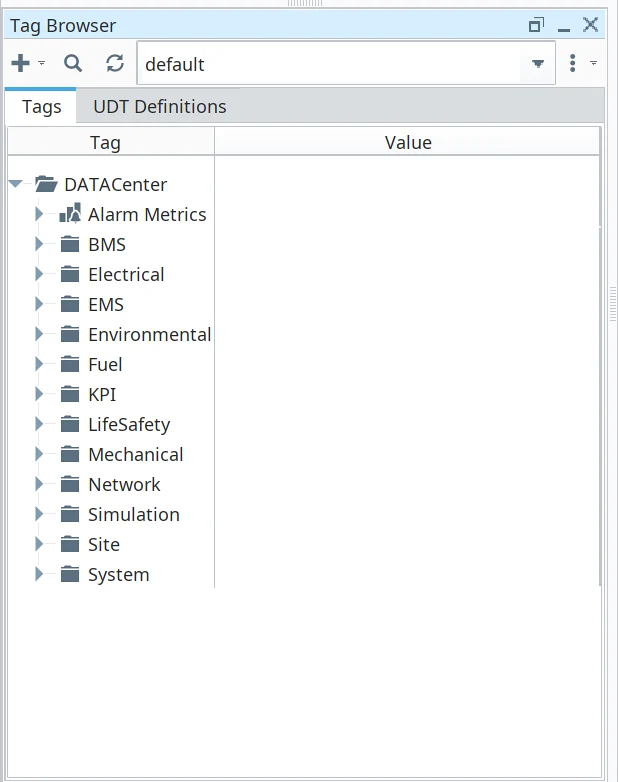
Tags sit under one DATACenter folder, split by domain: alarm metrics, BMS, EMS, electrical, environmental, fuel, KPI, life safety, mechanical, network, simulation, site, and system. A seventh script, SIM_07_SiteKPIs, updates the 60 site overview tags that the cards display.
The numbers in context
2,680 is the total the seven groups log for one complete pass, counted in tag updates: 935 electrical, 621 central plant, 558 airside, 226 environmental, 200 support systems, 80 liquid cooling, and 60 site KPIs. 5,000 ms is the configured timer delay, a fixed delay on a dedicated thread. It is not a measured execution time.
Limits and next steps
Everything is simulated; no field device is connected. The report sets out the path to production:
- Finalize tag and UDT standards
- Add the alarm lifecycle
- Historize critical points
- Integrate approved field data
- Harden the deployment